
Introduction
One of the biggest challenges traders face is knowing where price is most likely to go next.
Most traders either:
– React late to moves, or
– Continuously change bias based on short-term noise
The Next Day Model (sometimes referred to as the Next Candle Model) offers a structured and objective way to anticipate price behavior using only the previous candle.
This model is rooted in fractal principles, meaning it works across all timeframes – from monthly and daily charts down to intraday execution timeframes like the 1H or 5M.
In this article, we’ll break down:
– How the Next Day Model works
– What defines continuation vs. reversal
– How to combine it with phases of price delivery
– How to apply it practically to build daily trading bias
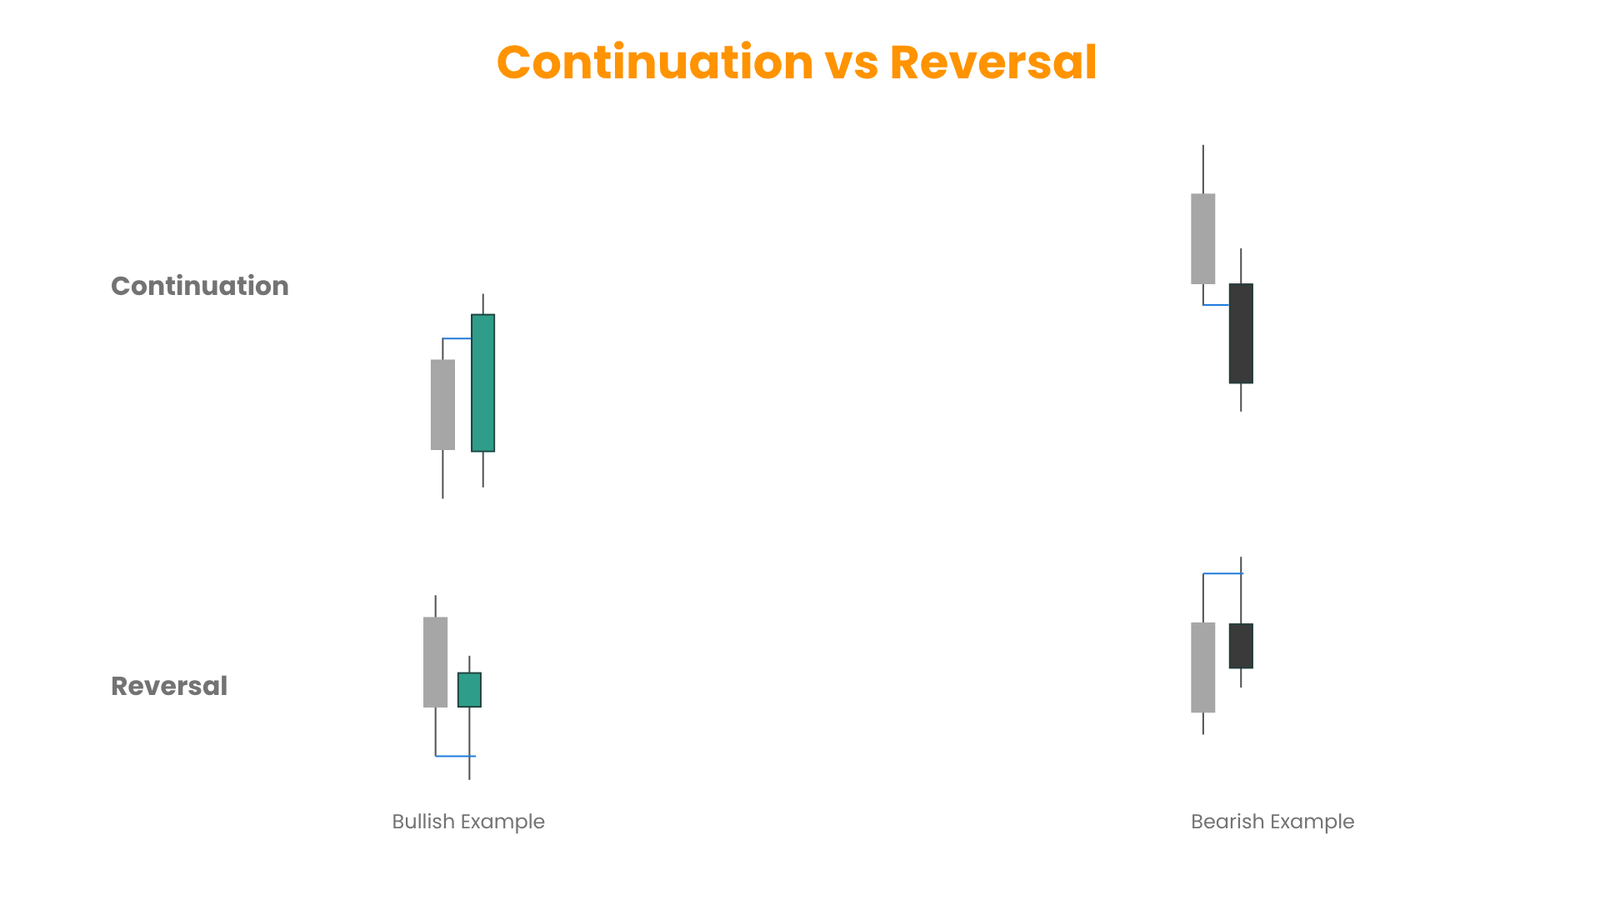
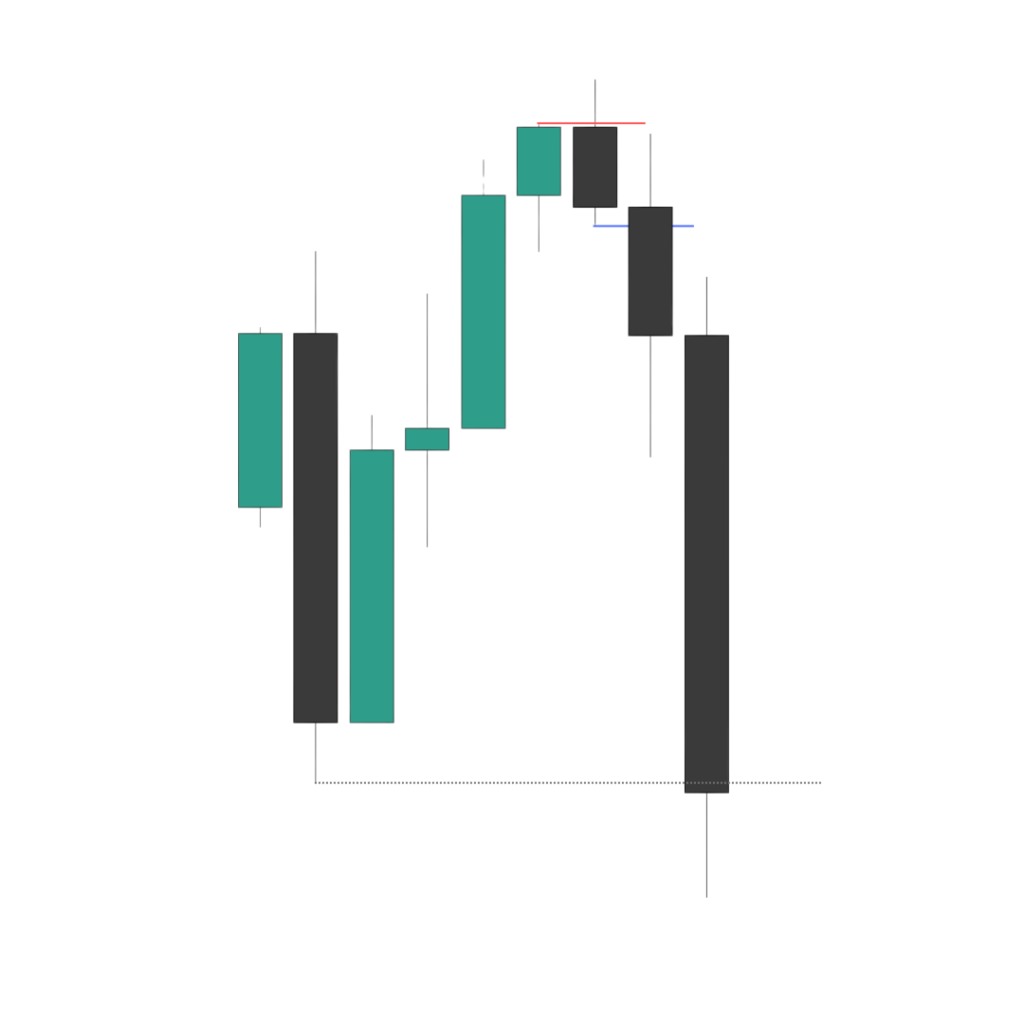
Continuation vs. Reversal
At its core, the Next Day Model is based on how price interacts with the previous candle’s high or low.
Reversal Behavior
A reversal is signaled when:
– Price sweeps the previous candle’s high or low
– Then closes back inside the prior range
Example:
– Yesterday’s high is taken
– Price fails to hold above it
– The candle closes back inside the range
This suggests potential bearish continuation on the next candle.
Continuation Behavior
A continuation is signaled when:
– Price sweeps the previous candle’s high or low
– Then closes outside the range
Example:
– Today closes above yesterday’s high
This signals bullish continuation for the following candle.
This simple relationship removes guesswork and helps traders define bias before the next session even begins.
Blending With Phases of Price Delivery
Price does not move in a straight line. Instead, it rotates through distinct phases:
– Expansion
– Retracement
– Consolidation
– Reversal
When price spends multiple candles expanding in one direction, probabilities begin to shift.
Example:
After three consecutive bearish continuation candles, price is statistically more likely to:
– Retrace
– Consolidate
– Or reverse
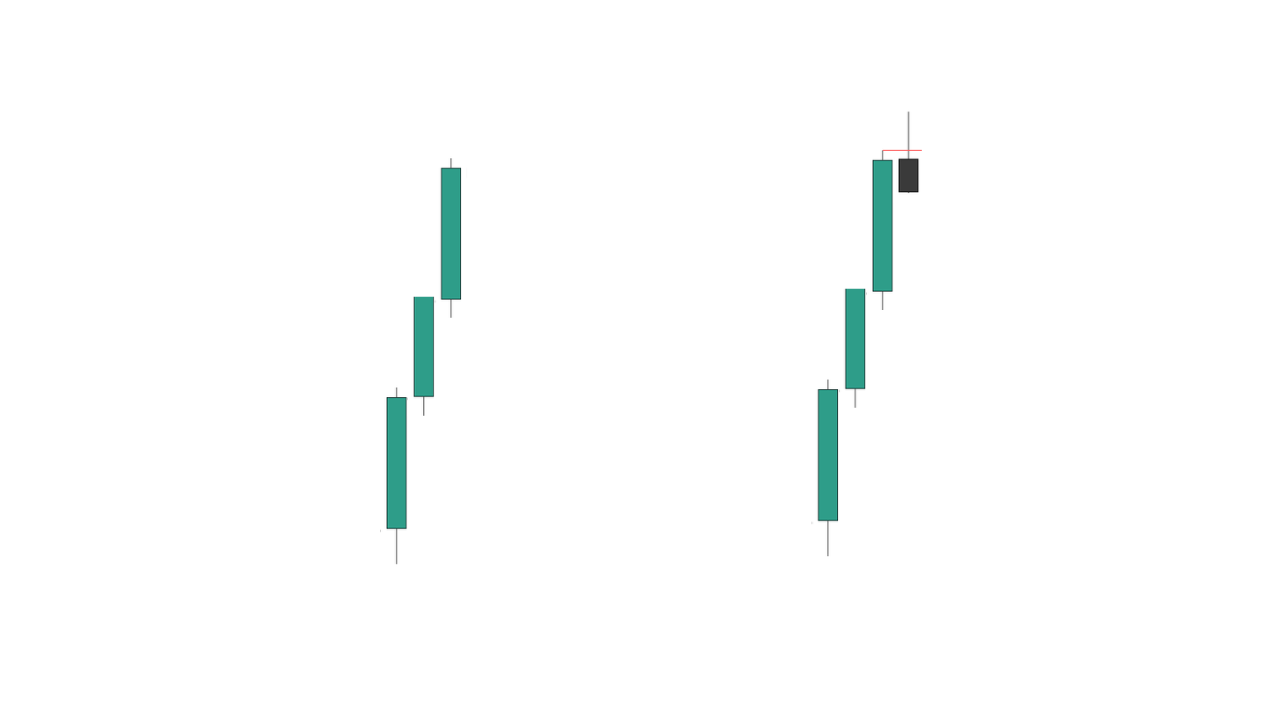
Instead of forcing continuation trades late in the move, the Next Day Model helps traders anticipate when expansion is likely to pause or shift.
This prevents:
– Shorting the low
– Longing the high
– Chasing already-delivered moves
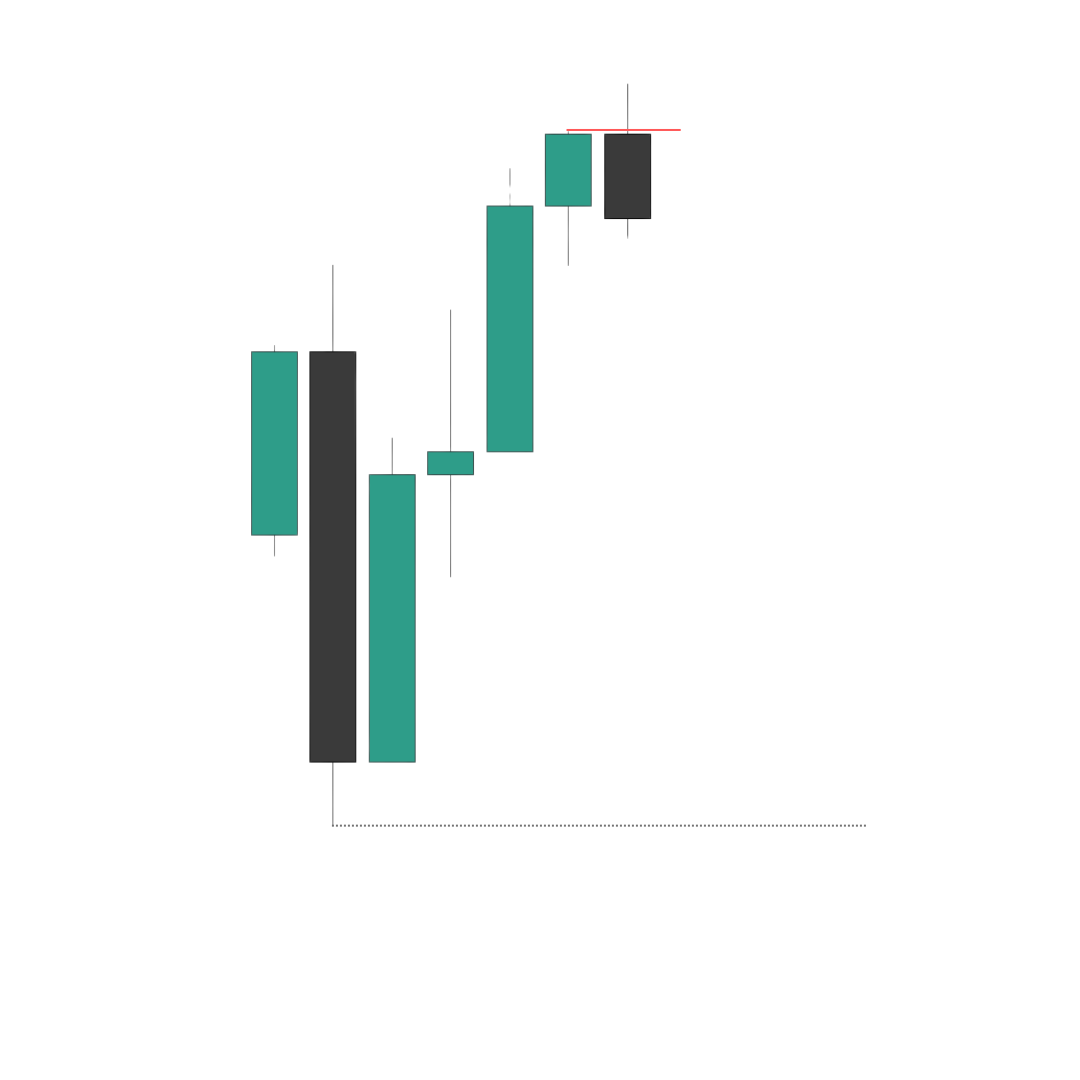
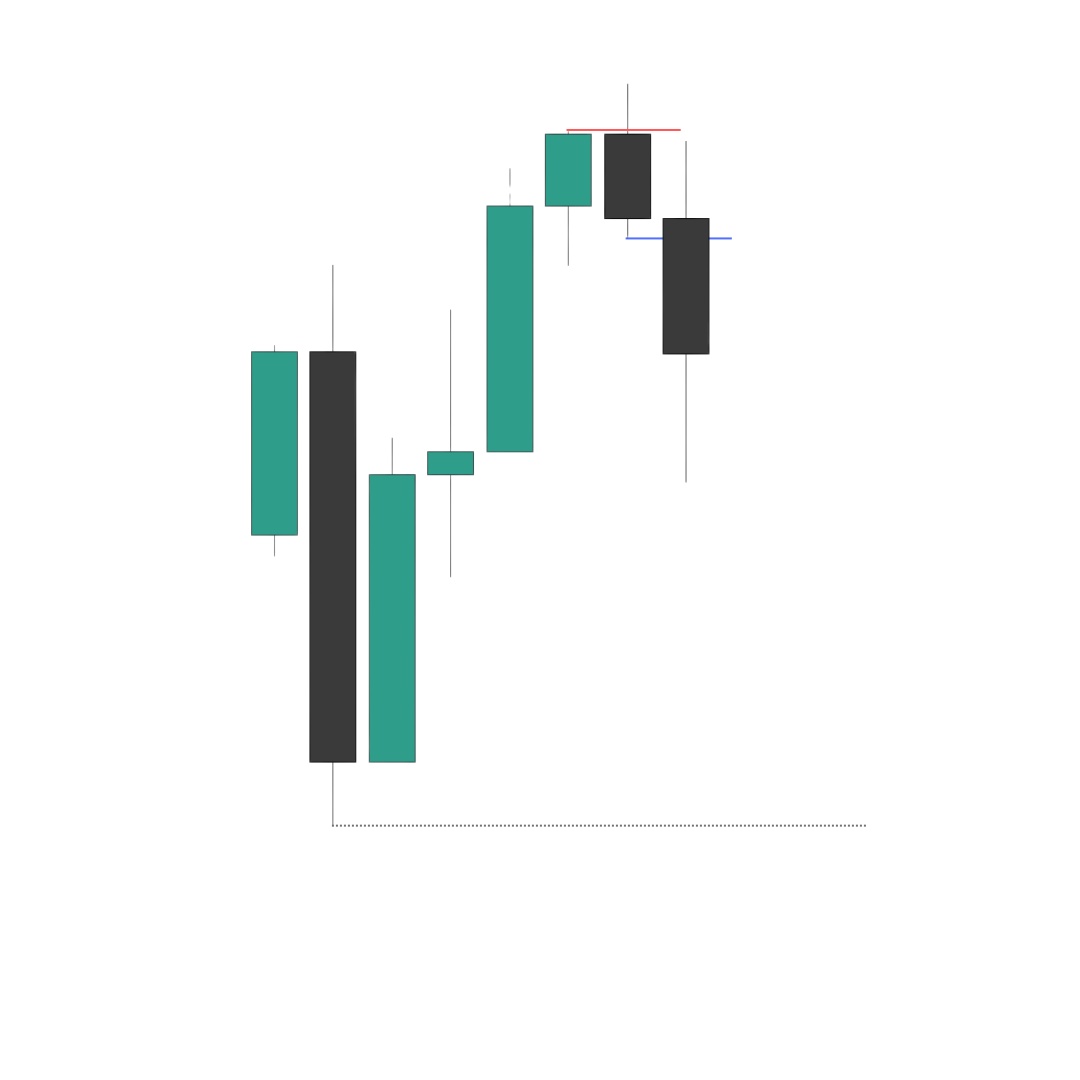
Practical Examples on the Daily Chart
When applying the model on the Daily timeframe, look for the following:
– Close above previous high → bullish continuation bias
– Sweep and close back inside → reversal bias
– Multiple expanding candles → expect a phase change
Examples
– Sweep of a daily high + close back inside → anticipate bearish price action the next day
– Daily candle closes below previous low → anticipate bearish continuation
Because the model is fractal, the same logic applies on:
4H, 1H, 15M, 5M etc..
Higher timeframes define bias, lower timeframes refine execution.
Why the Next Day Model Works in Practice
– It is mechanical and repeatable
– It removes emotional decision-making
– It works across all markets and timeframes
– It aligns naturally with ICT-based concepts and price delivery logic
You are no longer reacting to price – you are anticipating behavior.
Key Takeaways
– A close outside the previous candle’s high or low = continuation bias
– A sweep and close back inside = reversal bias
– Multiple continuation candles often precede retracement or reversal
– Use higher timeframes for bias, lower timeframes for execution
The Next Day Model is a simple yet powerful framework that helps traders build daily bias with clarity, while maintaining flexibility for intraday execution.
This model is regularly applied and refined inside my private trading community, where bias, execution, and accountability come together in real time.